Lissajous curves are a family of curves which can describe a complex harmonic motion. They are described with the following parametric equations:
x(t) = Ax sin (ωx t)
y(t) = Ay sin (ωy t + φ)
The parameters Ai define the amplitudes of the oscillations, the ωi are the frequencies and the φ is the phase offset between the two. The curve is typically ploted through the whole rotation: t = 0, ..., 2π.
The Lissajous curves could be produced by harmonographs (an apparatus that has a pendulum with some writing device attached to it), or on oscilloscopes, where the horizontal and vertical electromagnets would drag the electron beam along the screen. The general shape of the curve is very much dependent on the ratio between the frequencies ωx and ωy. The ratio defines the time it takes for the two orthogonal oscillations to coincide and thus the curve itself becomes more crossed and twisted. The change in phases φ in turn makes the curve rotate.
Lissajous curves are typically defined in two dimensions, but nothing bars an extension into 3D. In three dimensions the equations become:
x(t) = Ax sin (ωx t + φx)
y(t) = Ay sin (ωy t + φy)
z(t) = Az sin (ωz t + φz)
The parameters are quite alike as the ones described above. The only difference is the introduction of separate phase offsets for different axes.
I was quite interested to see the Lissajous curves in 3D. The changing of phase parameters while considering 2D equations often results in the plots twisting as if they were only a projection of a higher-dimensional entity which rotates. Adding the third dimension we can confirm it is indeed the case.
I made a Lissajous 3D curve generator, which is available HERE
The source code can be found on GitHub: https://github.com/dagothar/lissajous
The application is shown in fig. 1 below. You can change the parameters of the curve on the right: the amplitudes and the frequencies for the respective axes (X, Y and Z) can be selected with the combo boxes, while the phase shifts are set using the sliders. You can rotate the 3D view on the left by dragging the mouse around it.
 |
| Fig. 1. Lissajous curve generator. |
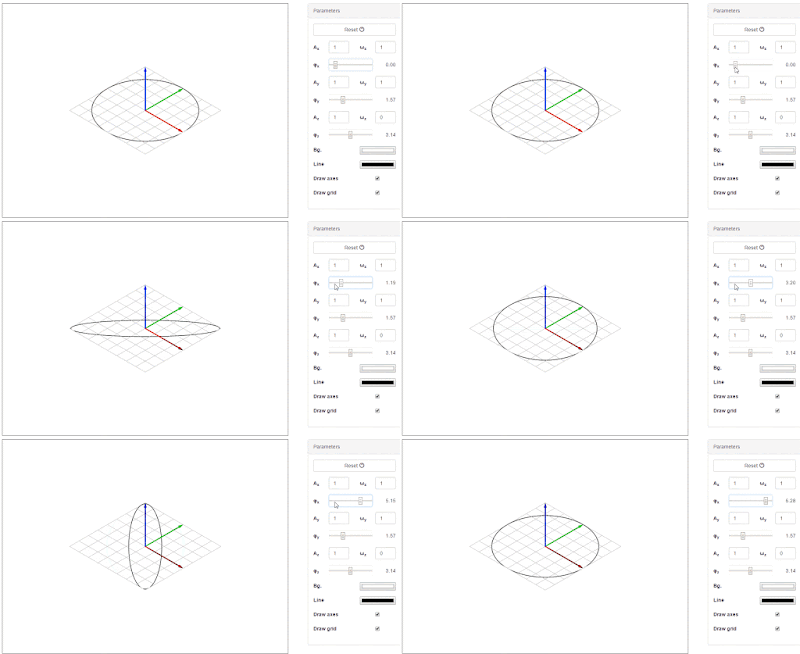
And here's a small gallery of examples.
 |
| Fig. 2. The most basic curve is just a circle (ωx=1, ωy=1, ωz=1). Changing the phase turns it into an ellipse. |
 |
| Fig. 3. The knot seems to rotate in the plane when changing the phase parameter (ωx=2, ωy=3, ωz=0, φx=0, φy=0:2π, φz=3.14). |
 |
| Fig. 4. The same knot as above with the third dimension added. The 3D curve projects into the same image. The rotation is now clearly visible. |
 |
| Fig. 5. Changing the ratio between the frequencies ωx and ωy. |
 |
| Fig. 6. This one looks like a twister (ωx=9, ωy=10, ωz=1, φx=0, φy=1.57, φz=3.14). |


No comments:
Post a Comment